Urban Big Data Analytics
Lecture 2Open Data Platform
July 18, 2019
Instructor: Andy Hong, PhD
Lead Urban Health Scientist
The George Institute for Global Health
University of Oxford
Assignment 1 check in
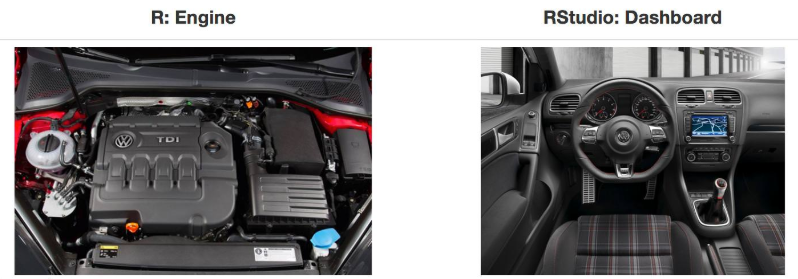
What are R and RStudio?
- Why two? not one?
- Open source software
- R is like an engine
- R Studio is like a dashboard
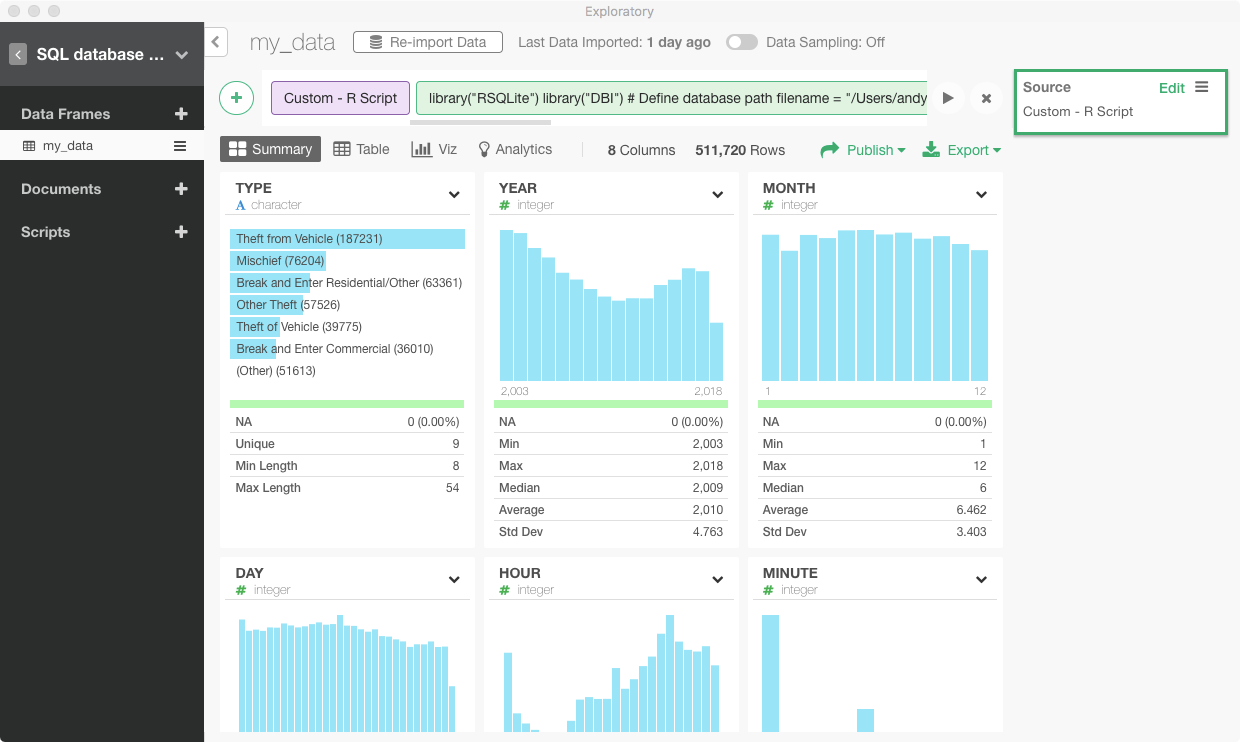
What is Exploratory?
- Graphical User Interface (GUI) for R
- Entirely based on tidyr language (more later)
- Make data wrangling a breeze
- User friendly and quick to learn
Exploratory
Open data platform
- Open data movement
- Smart cities, smart government
- More than 200 US cities/counties have open data
- Big cities leading the open data movement

NYC open data
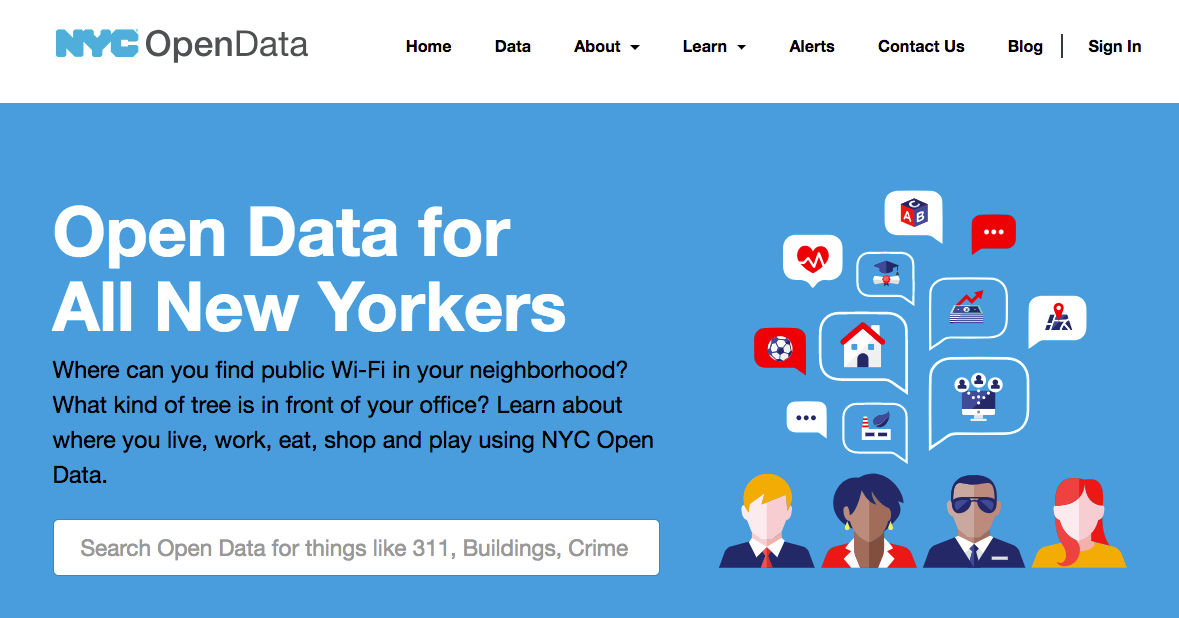
NYC open data
- More than 1,500 datasets
- A broad range of topics: e.g. budget, crime
- So much data generated every minutes
- Big cities = big data = big tasks
- From big data to smart cities
- Most commonly accessed data
New school, new era

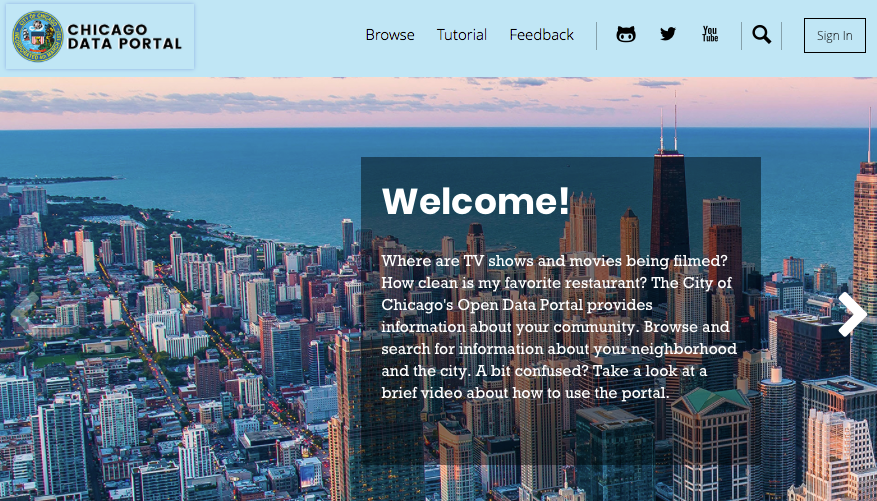
Chicago open data
Array of things
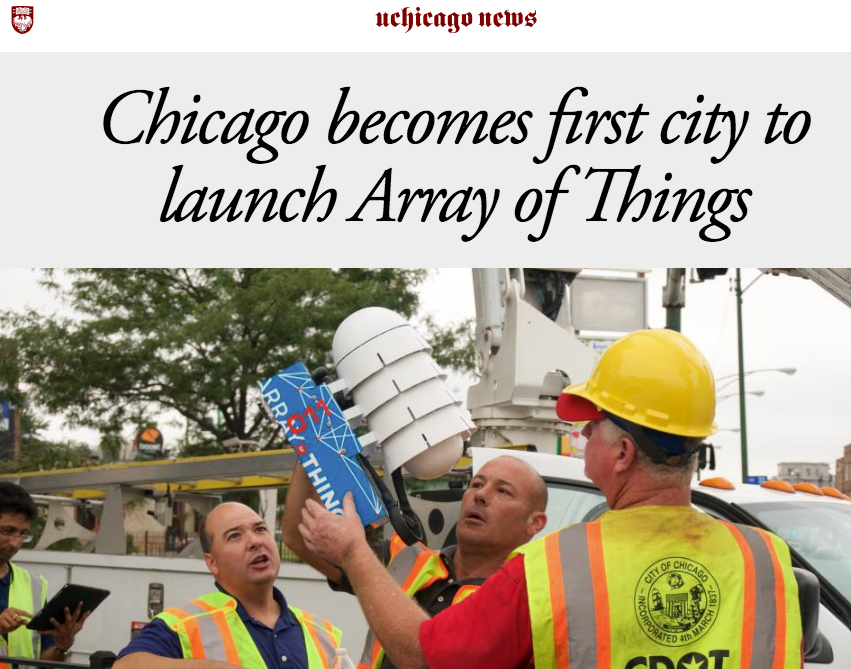
Array of things
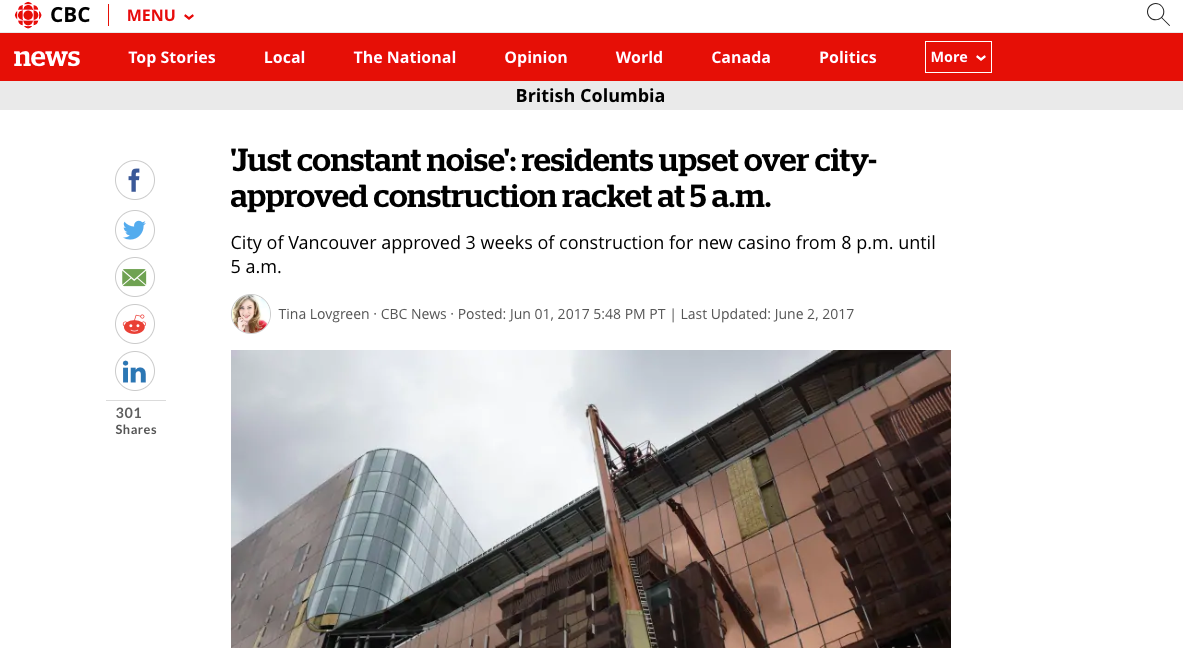
https://www.youtube.com/watch?v=BHrsllHJHeoVancouver open data

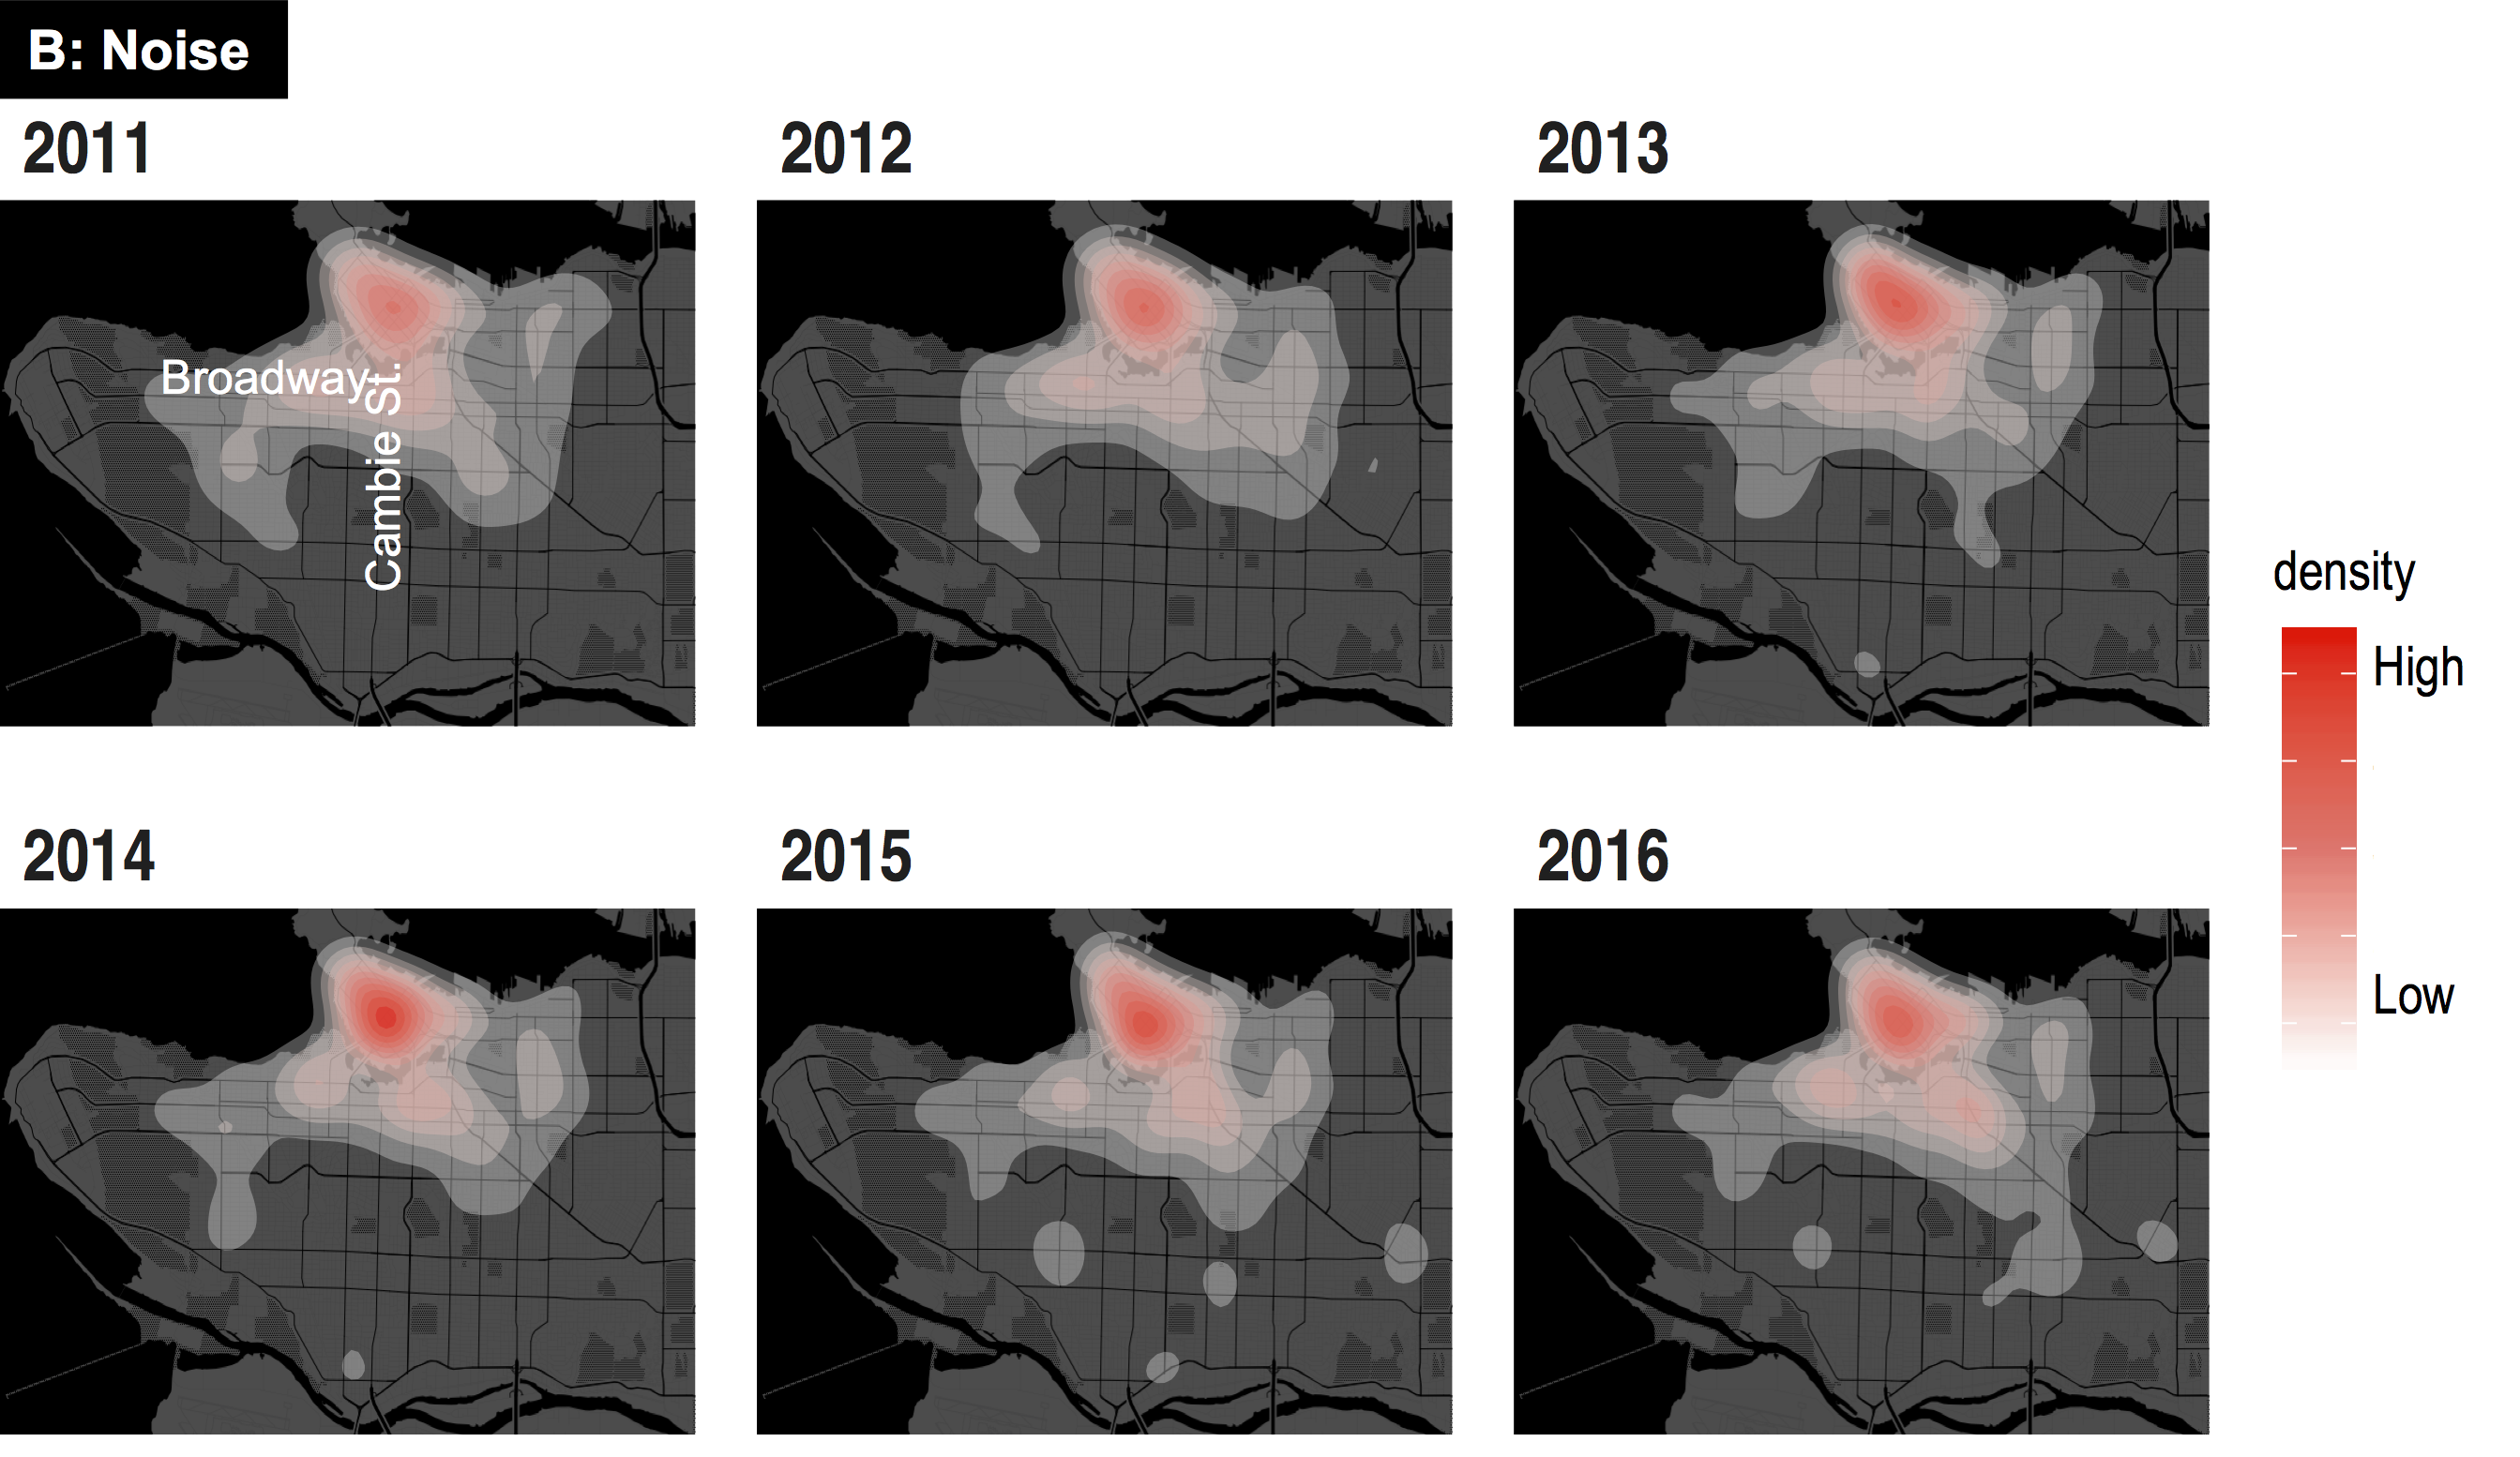
Case study - Noise 311
Hong et al. 2019. Noise and the City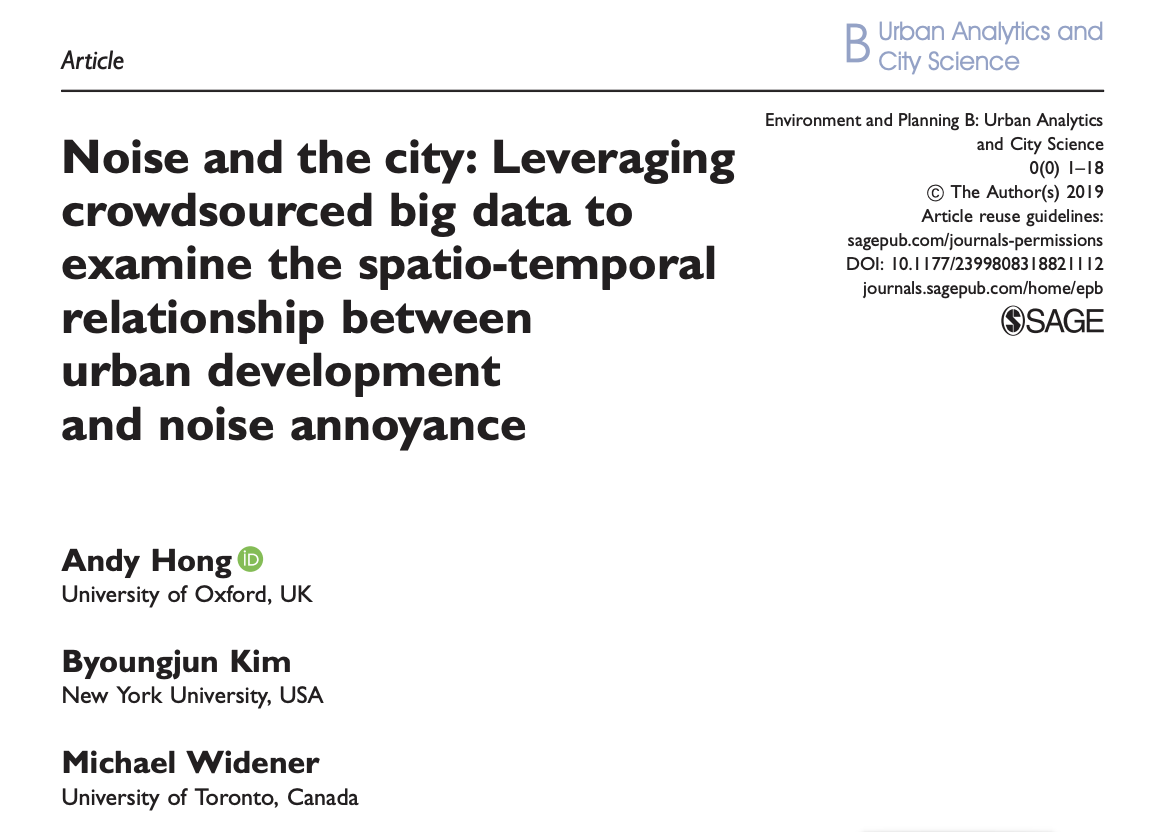
Construction noise
Sources of urban noise

Vancouver 311 call center
- Garbage disposal
- Road maintanenance
- Graffiti removal
- Noise complaints
- ...
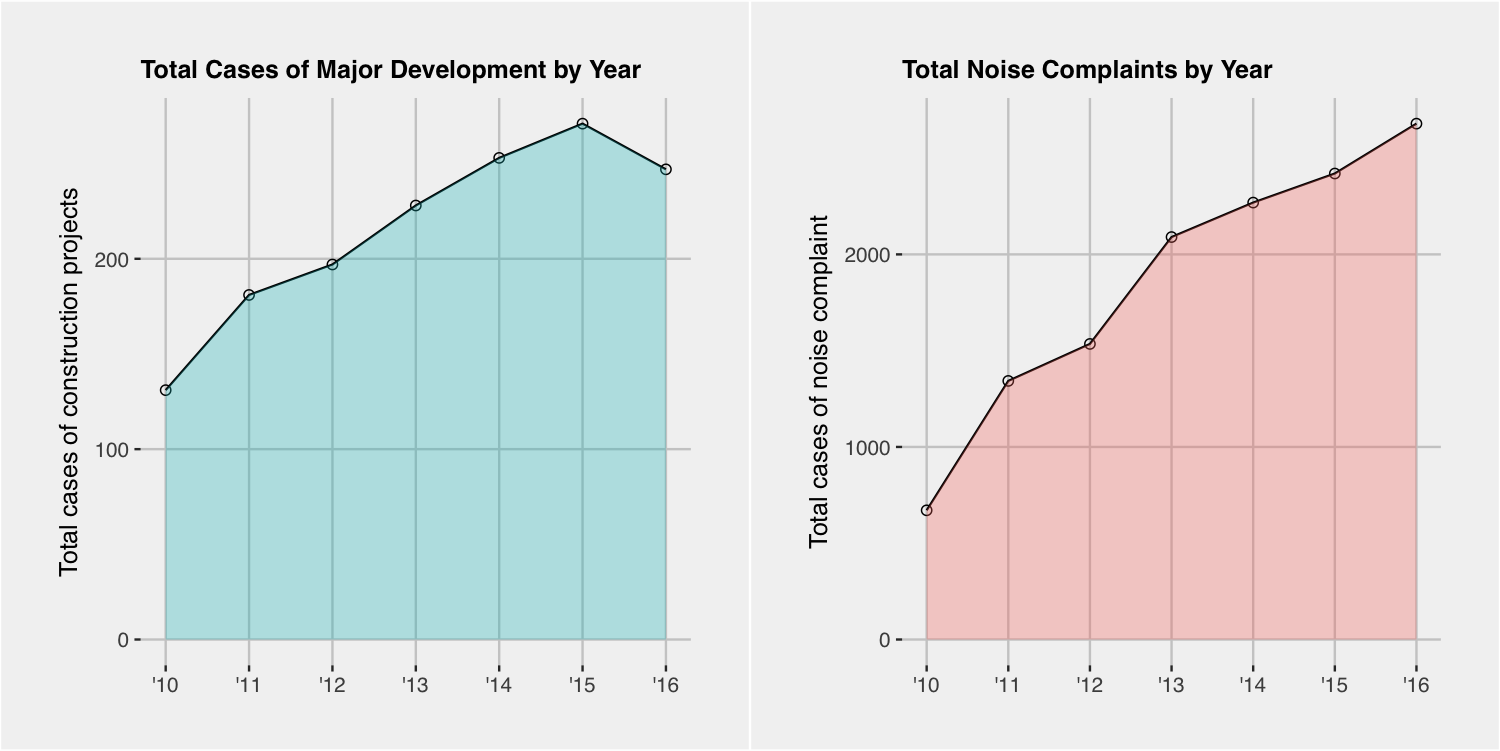
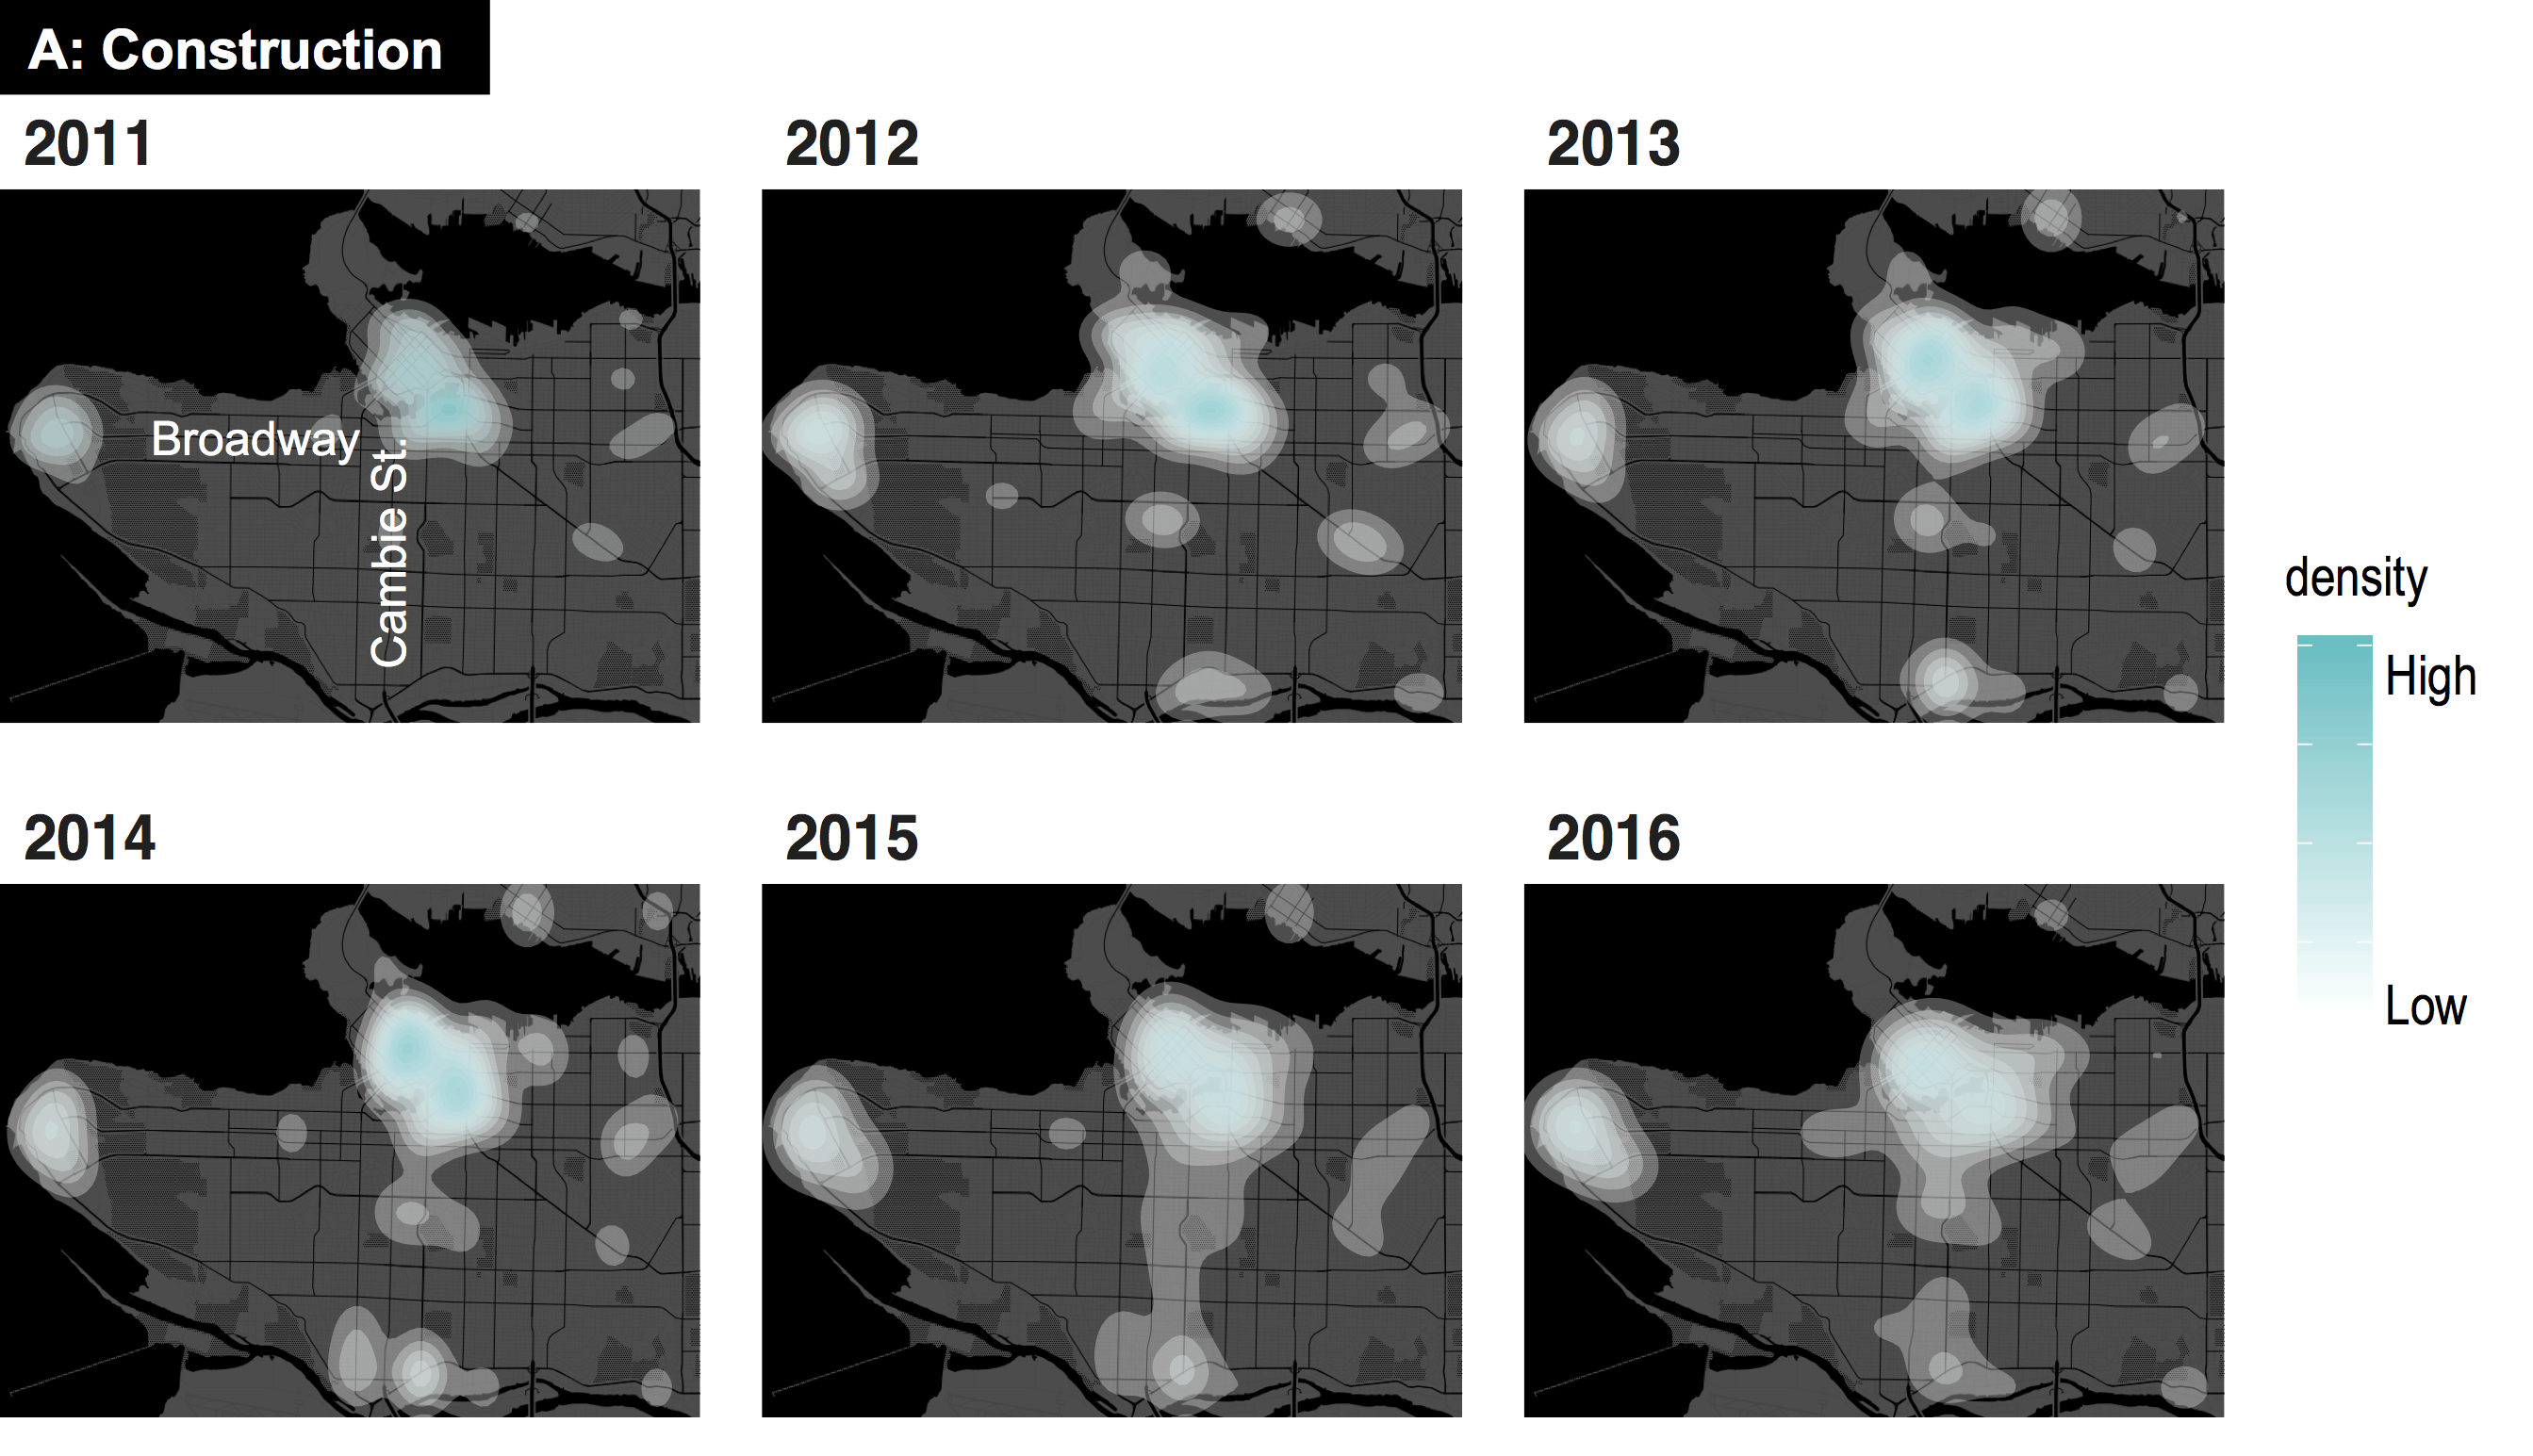
Major Constructions

Construction and noise
Heatmap of construction
Heatmap of noise complaints
How to access open data?
- Traditional way: direct download and import data
- Programming way: Application Programming Interface (API)

API Demo (advanced material)
- Chicago Open Data - Crime Data
- R packages for using API endpoints: RCurl + jsonlite
- Base R code to access API endpoint