Urban Big Data Analytics
Lecture 10Advanced Modeling
July 31, 2019
Instructor: Andy Hong, PhD
Lead Urban Health Scientist
The George Institute for Global Health
University of Oxford
Final group project
- Five elements: 1. Problem; 2. Hypotheses; 3. Data and methods; 4. Results and Interpretation; 5. Conclusions
- Minimum 6 page, single space, Times New Roman 12 font size
- August 8 (Weds), 12:00 Midnight
Final group presentation
- Presentation (12 mins), Q&A (2 mins)
- Each group member needs to present
- Share some preliminary results
Special Guest Speakers
A 14-week program to work on collaborative projects
2019 DSSG Fellows

Advanced modeling
Beyond linear regressions
- Linear models are good for numbers
- But, what about categorical data?
- What about survey data with yes or no questions?
- Can you convert categories into numbers?
BC Generations Survey

Survey questionaires

Logistic Regression

- "Logit" regression
- "Logit" model
- Developed by David Cox in 1958
- Regression model for categorical outcome Y
Sir David Cox (age 95)

Why Logistic Regression?
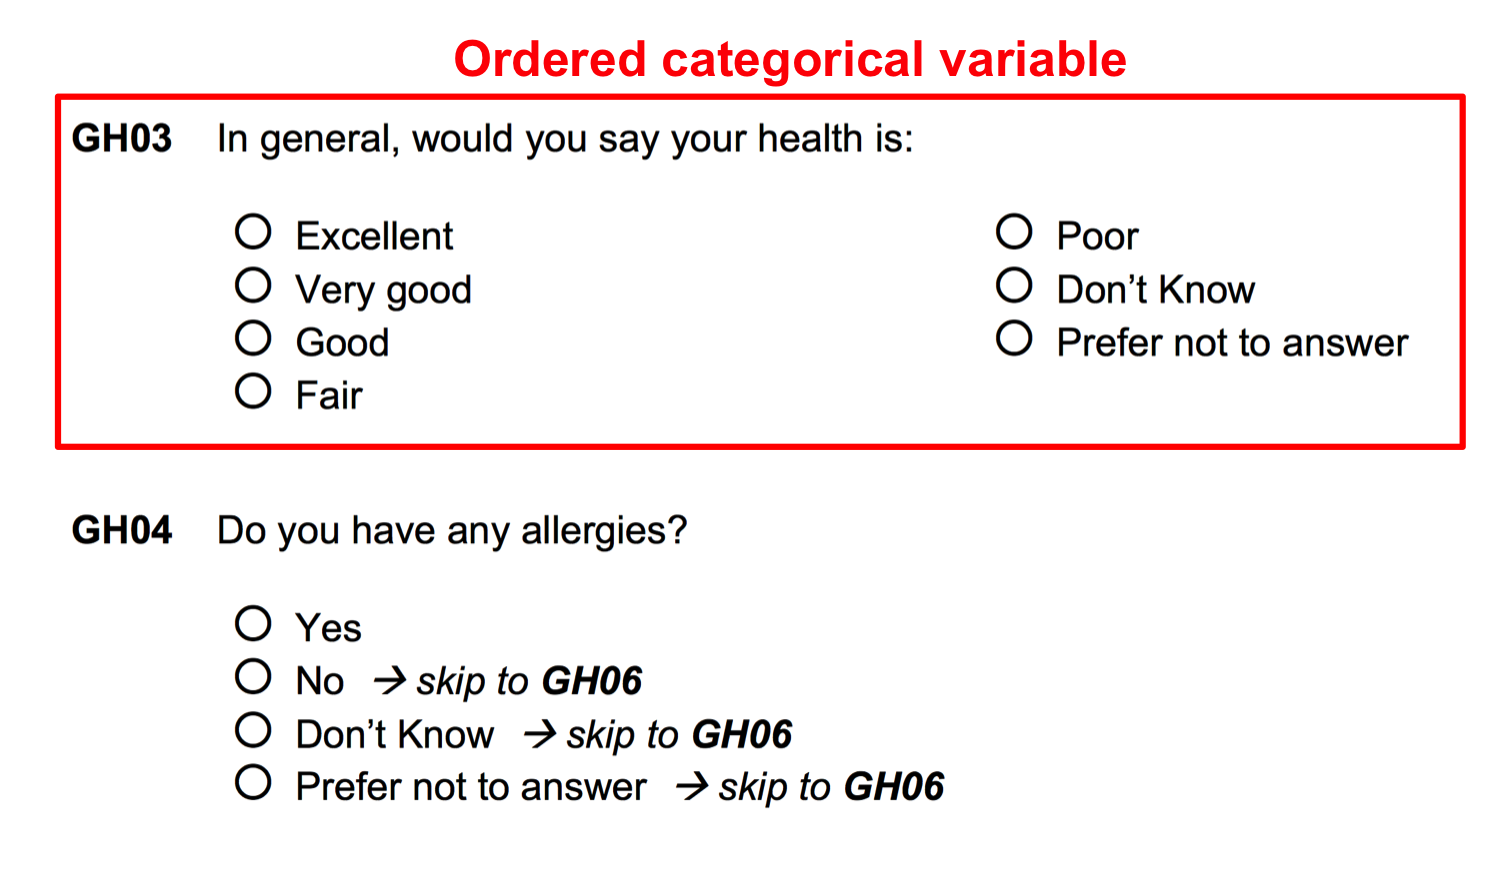
- Linear model, not appropriate for a qualitative response
- Ex) Question - How would you rate this course?
- Aweful - Okay - Good - Very Good - Excellent
- Can we turn this into 1-2-3-4-5?
- No, because the distance between each item is not the same
Types of Logistic Regression
- Simple logistic model
- Binary outcome: "0" and "1"
- Pass/Fail, Win/Lose, Dead/Alive, Sick/Healthy
- Multinomial logistic model
- Multiple categorical outcomes
- A range of values: Unsatisfied - Satisfied - Very Satisfied
Logistic Regression

|

|
Linear vs. Logistic Regression
| Linear function | Logistic function |
|---|---|
|
$$ f(x) = \beta_{0} + \beta_{1}x $$
|
$$ f(x) = \frac{e^{\beta_{0} + \beta_{1}x}}{1 + e^{\beta_{0} + \beta_{1}x}} $$ $$ \log_e (\frac{p}{1-p}) = \beta_{0} + \beta_{1}x $$
|
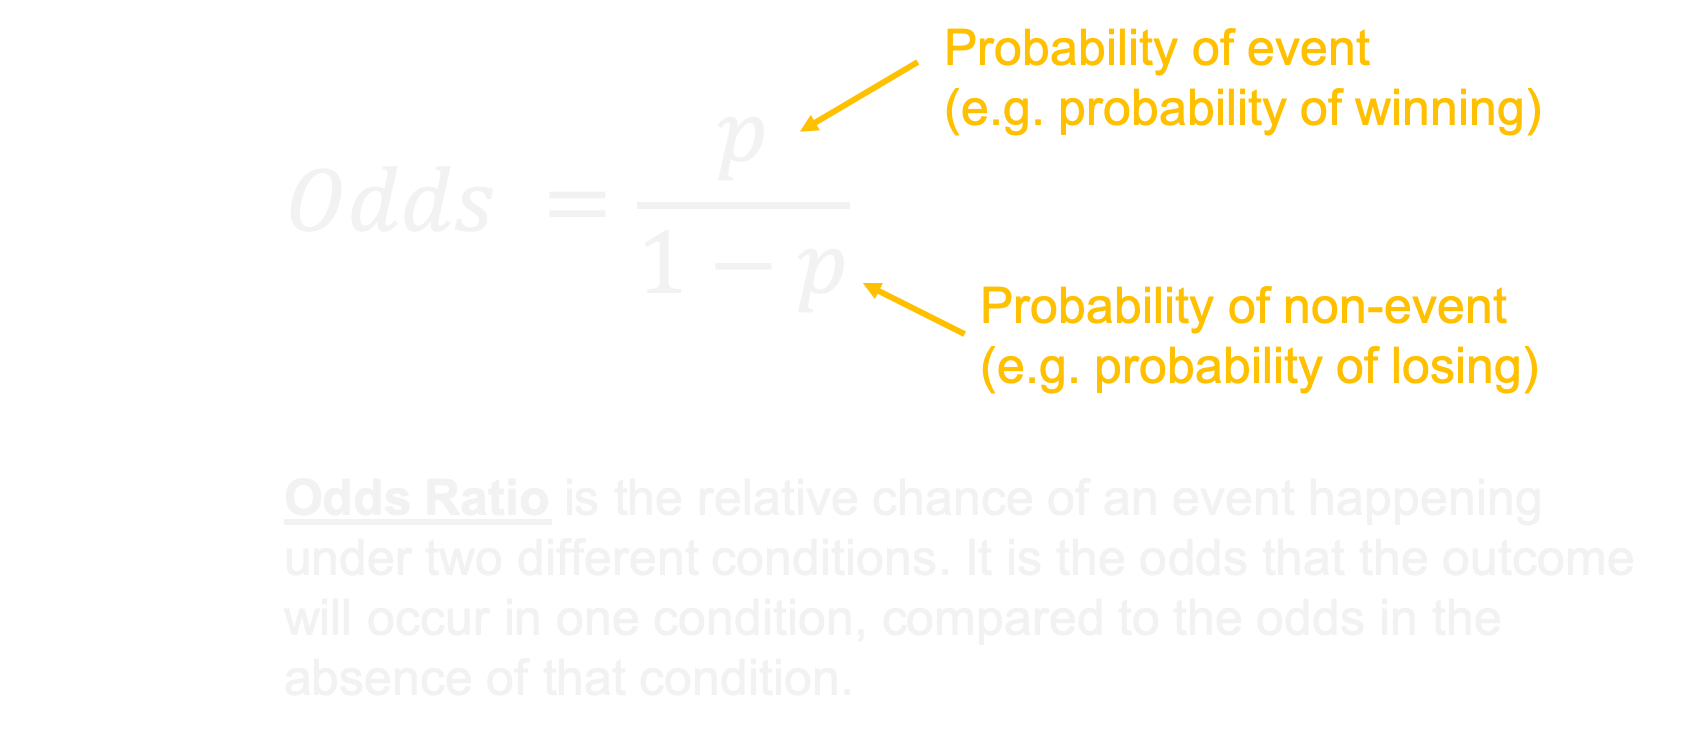
Log Odds

Odds

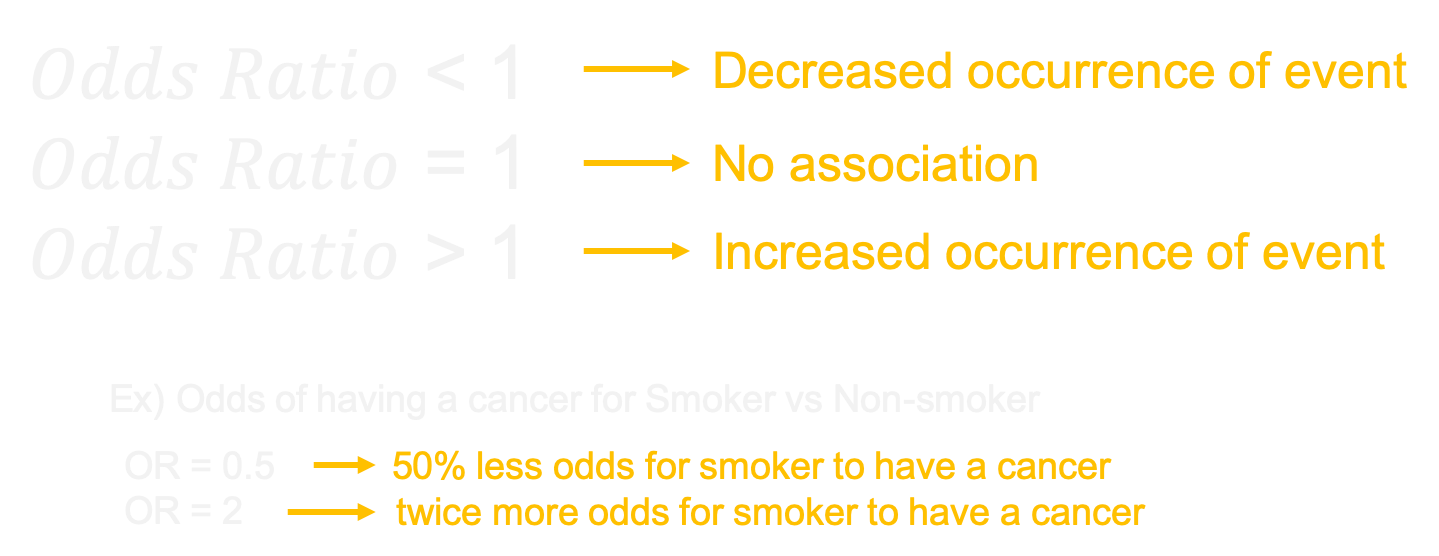
Odds and Odds Ratio
Odds Ratio Example
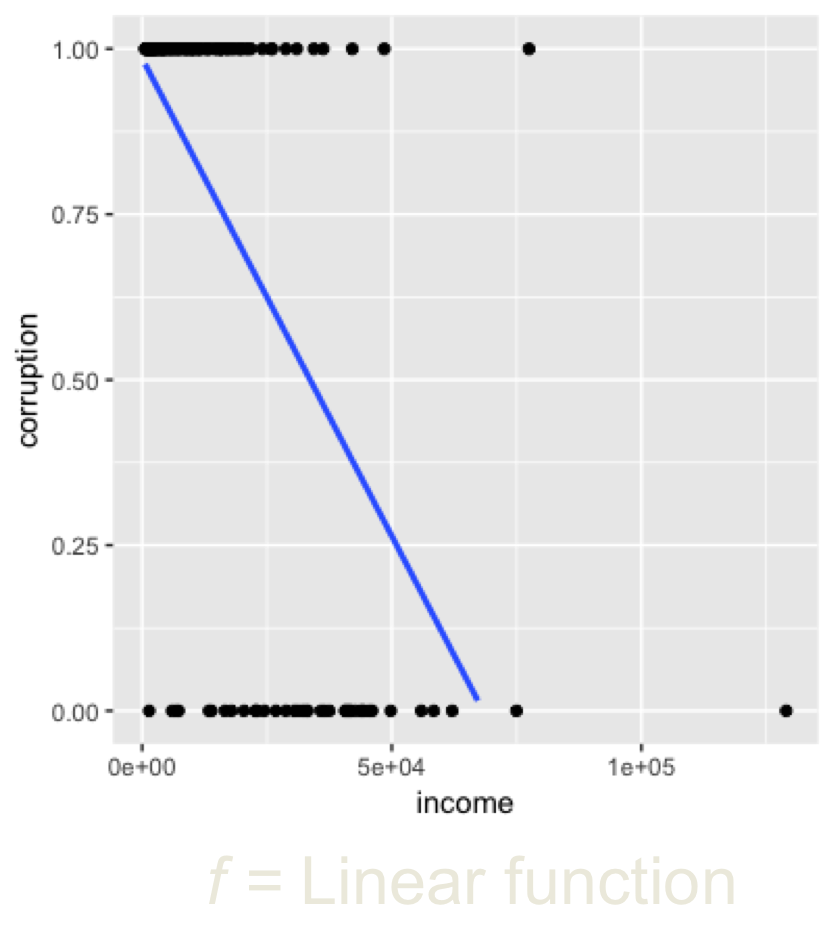
Simple Logistic Regression
$$ corruption \approx f(income) $$
					# Simple Logit Model
					m1 = glm(data = gapminder,
							 corruption ~ income,
							 family = "binomial")

					exp(coef(m1))
					confint(m1)
Multiple Logistic Regression
$$ corruption \approx f(income, population, democracy) $$
					# Multiple Logit Model
					m2 = glm(data = gapminder,
							 corruption ~ income + population + democracy,
							 family = "binomial")

					exp(coef(m2))
					confint(m2)
2019 DSSG Fellows